
How to Draw and Interpret Titration Curves (All Four Types)



Titration curves trip up a lot of students, and it’s usually not because the chemistry is hard. The problem is that there isn’t just one curve. There are four main combinations of strong and weak acids and bases, and each produces a characteristic curve.
You might be perfectly fine doing an actual titration in the lab, but turning that into a graph is a different skill. Most students get stuck on the same four questions:
- Where does the curve start?
- Where exactly is the equivalence point?
- Is that point above, below, or at pH 7?
- How do I find the buffer region and the half-equivalence point?
Here’s the good news: you don’t need to memorise four shapes.
The shape of a curve is just a picture of what’s happening chemically as you add the titrant. Once you know if your acid and base are strong or weak, you can work out the shape yourself.
This guide covers all four curve types, how to draw each one, how to find the equivalence point, and how to pull a pKa value straight off the graph.
What is a titration curve?
A titration curve is a graph that shows how the pH changes as you add a measured volume of acid or base. Yes, it’s that simple!
The axes in the curve
Get these right because swapping them is a surprisingly common way to lose marks.
- Y-axis = pH
- X-axis = volume of titrant added, usually in cm³
Two words for the two solutions
A titrant is the solution you add from the burette. An analyte is the solution already sitting in the flask (some papers also call it “the solution being titrated”).
The equivalence point
The equivalence point is where the acid and base have reacted in exactly the amounts the equation calls for. In other words, it’s when you’ve added just enough titrant to react with everything in the flask.
On a typical titration curve with a clear, steep section of rapid pH change, the equivalence point is approximately at the midpoint of that section.
Note that the equivalence point is not the endpoint. An equivalence point is theoretical and is the exact point where the mole ratio works out. By comparison, the endpoint is what you actually see, i.e. the moment your indicator changes colour.
A suitable indicator changes colour within the steep pH-change region near the equivalence point, so the endpoint is close to the equivalence point. However, they are not the same thing. Remember it because examiners love this distinction.
The four types of titration curve
There are four combinations you need to know:
- Strong acid + strong base
- Weak acid + strong base
- Strong acid + weak base
- Weak acid + weak base
The two questions to ask before drawing
Before you draw a single line, answer these:
- What’s in the flask, and is it strong or weak?
- What’s being added, and is that strong or weak?
That’s all you need, as those two answers can tell you four things already:
- Where the curve starts (the starting pH)
- Which way it goes (up or down)
- How steep it gets near equivalence
- What pH the equivalence point sits at
Get into the habit of writing those two answers down before drawing, as it can prevent most mistakes.
Curve 1: Strong acid + strong base
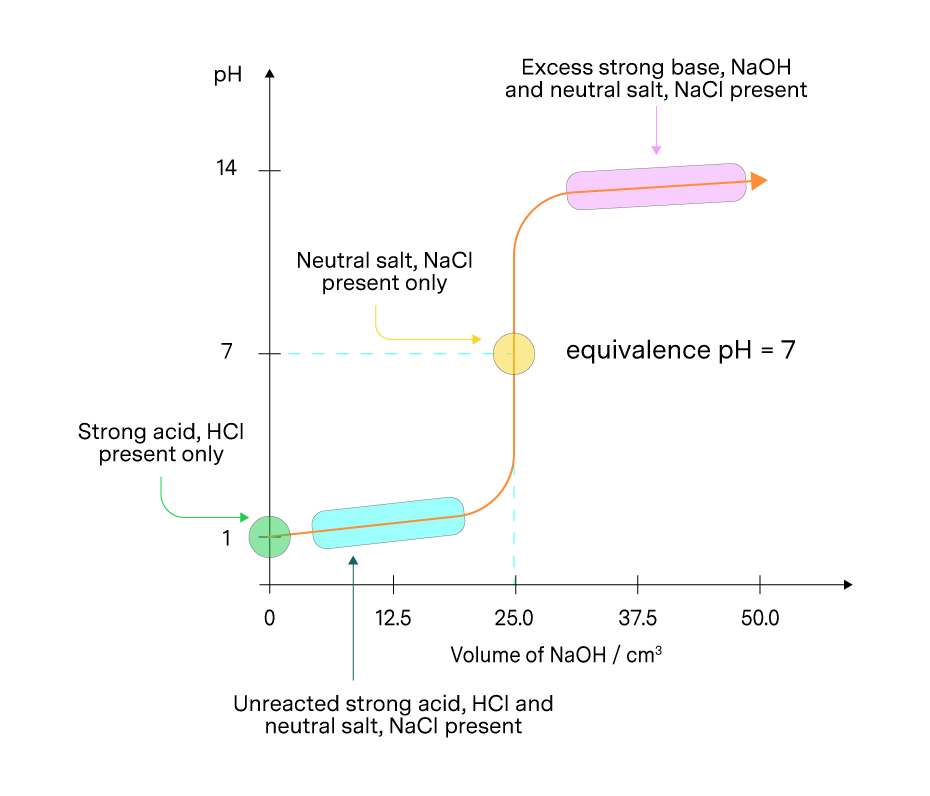
Let’s use the classic example: HCl in the flask, NaOH added from the burette.
1. Starting pH
The curve starts low, around pH 1 for a typical concentration. That’s because a strong acid ionises completely, so there are plenty of free H⁺ ions.
2. Before the equivalence point
Each drop of OH⁻ you add reacts with an H⁺ ion in the flask. The pH creeps up slowly. There’s still a lot of acid left, so removing a bit barely changes things.
3. Approaching the equivalence point
Now the pH rises very sharply. Near the equivalence point, only a small amount of acid remains in excess. A small additional volume of NaOH can cause a large pH change as the solution moves from acidic to alkaline.
4. At the equivalence point
The acid and base have reacted in exactly matching amounts. For a strong acid with a strong base at 25°C, this lands at about pH 7. The salt formed (NaCl) doesn’t affect the pH.
5. After the equivalence point
You’re now adding excess NaOH to the flask. The curve gradually levels off at a high pH, with the final pH depending on the concentration and volume of excess NaOH.
What if you swap them round?
Put the strong base in the flask and add strong acid instead. You get the same shape upside down. It starts high, drops steeply through pH 7, and levels off low.
Curve 2: Weak acid + strong base
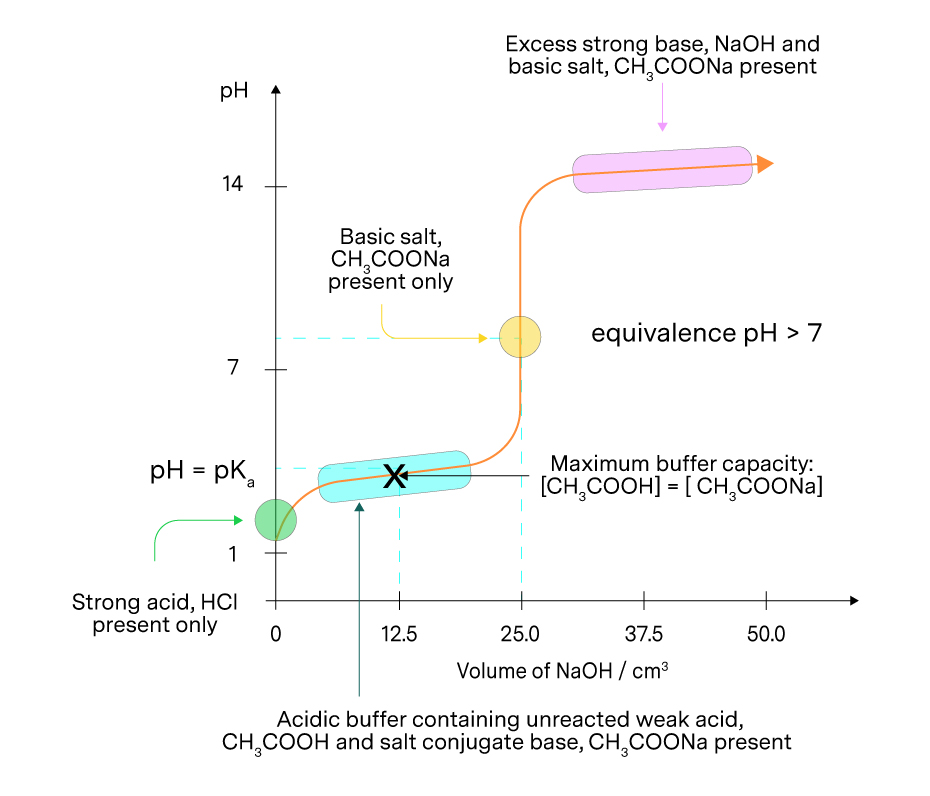
This is the most important curve to understand. It’s also the one that shows up most in exam questions.
Our example: ethanoic acid (CH₃COOH) in the flask, sodium hydroxide (NaOH) added.
1. Starting pH
The curve starts at a higher pH than that of a strong acid of the same concentration. For illustration, a weak acid might start around pH 3, compared with around pH 1 for a strong acid, depending on their concentrations and the weak acid’s strength.
Why? Because a weak acid only partially ionises, so there are fewer free H⁺ ions to begin with.
2. As you add the base
The NaOH gradually converts the ethanoic acid into its conjugate base, the ethanoate ion. So the flask slowly fills up with a mixture of both.
3. The buffer region appears
Before the equivalence point, some of the weak acid has been neutralised, leaving a mixture of the weak acid and its conjugate base. This mixture acts as a buffer, resisting large changes in pH as more base is added.
The pH rises very gently through this stretch. On the graph, it looks like a flat-ish plateau.
4. The half-equivalence point
At the half-equivalence point, half of the original weak acid has been neutralised. For a monoprotic weak acid titrated with a strong base, the concentrations of the remaining weak acid and its conjugate base are equal.
At this point, pH = pKa. This relationship allows you to estimate the acid’s pKa from the titration curve.
That gives you a way to read the pKa of an unknown acid straight off a graph. The next section walks through exactly how.
5. The equivalence point
This one sits above pH 7, not at it. At equivalence, the flask is full of ethanoate ions. These react with water (that’s hydrolysis) and produce OH⁻ ions, which pushes the pH up.
The pH jump around equivalence is generally less pronounced than in a strong acid–strong base titration.
6. After the equivalence point
Beyond the equivalence point, excess NaOH determines the pH, and the curve gradually levels off at a high value.
How to determine pKa from a titration curve
This comes up a lot and it’s only four steps. It works for a weak acid titrated with a strong base.
Step 1. Find the equivalence point.
Look for the steep, near-vertical section of the curve. When this section is clearly defined, its midpoint gives an estimate of the equivalence point. Read off the volume of titrant at that point.
Step 2. Halve that volume.
Divide the equivalence volume by two. This gives you the half-equivalence volume.
Step 3. Read the pH at that volume.
Go to your halved volume on the x-axis. Draw a line up to the curve then across to the y-axis.
Step 4. That pH is your pKa.
That’s the answer. No calculation needed.
A worked example
Suppose the equivalence point occurs when 20.0 cm³ of NaOH has been added. The half-equivalence volume is 10.0 cm³.
If the pH at 10.0 cm³ is 4.76, then the pKa of the weak acid is approximately 4.76.
Why this works
You don’t strictly need this for the method, but it helps it stick. There’s an equation called the Henderson-Hasselbalch equation.
It says:
Here, [HA] is the weak acid. [A⁻] is its conjugate base. At the half-equivalence point, those two are equal, so the fraction becomes 1.
And log(1) = 0. So, the whole last term in the equation disappears and leaves only pH = pKa.
Curve 3: Strong acid + weak base
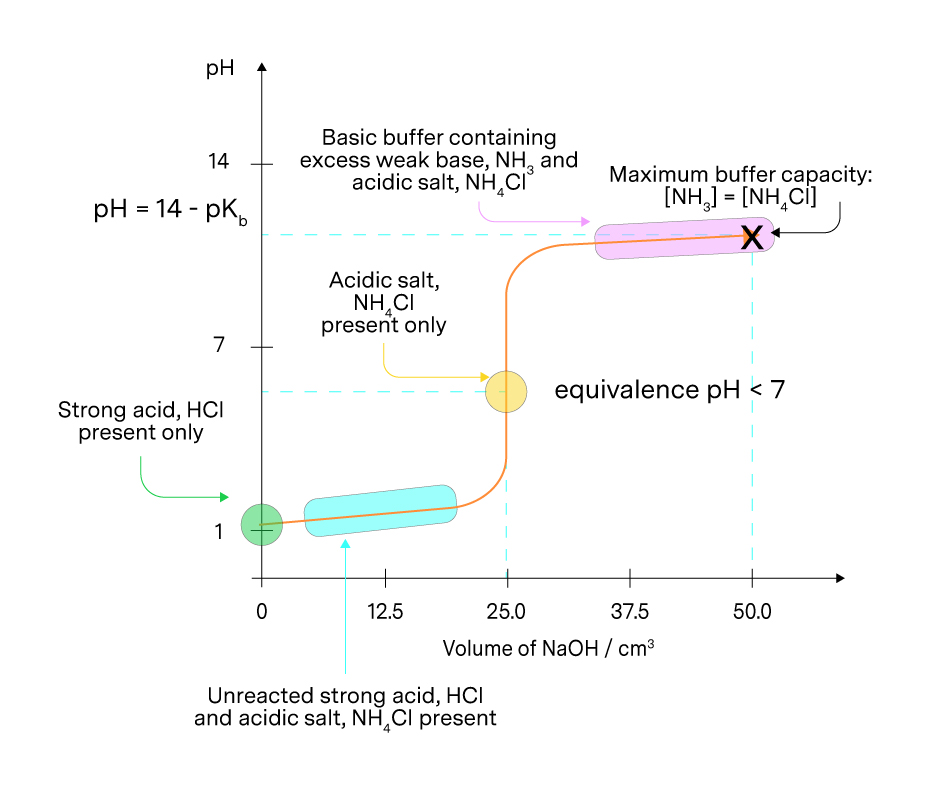
For this one, let’s use the example of hydrochloric acid HCl in the flask, ammonia (NH₃) added from the burette.
1. Starting pH
Strong acid in the flask, so the curve starts low again at around pH 1.
2. As you add the weak base
The ammonia reacts with the H⁺ ions and the pH climbs.
3. Around the equivalence point
There’s still a pH jump, but it is generally less pronounced than in curve 1. Because the added base is weak, the pH does not rise as sharply into the alkaline range as it would with a strong base.
4. At the equivalence point
The equivalence point lies below pH 7. At equivalence, the hydrochloric acid and ammonia have reacted in the required stoichiometric ratio, leaving ammonium ions (NH₄⁺) in solution. These ions act as a weak acid and undergo hydrolysis with water to form hydronium ions (H₃O⁺), making the solution acidic.
5. After the equivalence point
Here’s a detail students often miss. The buffer region in this titration appears after equivalence, not before.
Beyond the equivalence point, excess NH₃ is present alongside the NH₄⁺ formed during the reaction. This weak base and its conjugate acid form a buffer, so the pH changes more gradually as more ammonia is added.
The pH generally remains lower than it would if a strong base were added under otherwise comparable conditions.
Curve 4: Weak acid + weak base
For this one, let’s do ethanoic acid in the flask, ammonia added.
This curve will be the odd one out, and it’s actually the easiest to draw once you know the trick.
Both substances ionise only partially, so the pH change around the equivalence point is generally more gradual than in a strong acid–strong base titration. Depending on the relative strengths and concentrations of the acid and base, the curve may have no clearly defined steep section.
Without a clear, steep pH change, the equivalence point can be difficult to identify accurately using an indicator. A pH meter can be used to monitor the pH throughout the titration, although the equivalence point may still be difficult to pinpoint if the curve is very shallow.
What pH is the equivalence point?
It depends on the relative strengths of the weak acid and the weak base.
The equivalence-point pH depends on the relative strengths of the weak acid and weak base.
If the acid is stronger, the solution is generally acidic at equivalence. If the base is stronger, it is generally alkaline. If their strengths are similar, the pH may be close to 7.
Don’t automatically assume the equivalence point is at pH 7. If the question provides \(K_a\) and \(K_b\) values, use them to assess the relative strengths and determine the expected pH. Otherwise, state that it depends on their relative strengths.
All four curves at a glance
If you memorise one thing from this guide, make it this table.
How to find the equivalence point on a titration curve
The short version: look for the steepest part of the curve, then take its midpoint. That’s where the equivalence point sits on nearly every acid-base titration curve.
The critical thing not to do: assume pH 7. That’s a major trap.
For the four common combinations, use this quick recall list:
- Strong acid + strong base → approximately pH 7
- Weak acid + strong base → above pH 7
- Strong acid + weak base → below pH 7
- Weak acid + weak base → depends on the relative acid and base strengths
What if you’re given a table of data instead of a graph?
If the question gives you raw readings instead of a drawn curve, look for the largest pH change over the smallest volume interval. If the data show a clear pH jump, the equivalence point is usually estimated to lie within that interval.
For example, if the pH rises from 4.2 to 9.8 between 24.9 cm³ and 25.1 cm³, the equivalence point is likely to be around 25.0 cm³.
How to draw a titration curve: a seven-step checklist
Use this every time so you’ll never have to guess a shape.
- Identify what’s in the flask
- Acid or base?
- Strong or weak?
- Determine the starting pH
- Strong acid → generally lower starting pH
- Weak acid → generally higher starting pH than a strong acid of comparable concentration
- Strong base → generally higher starting pH
- Weak base → generally lower starting pH than a strong base of comparable concentration
- Determine whether the graph rises or falls
- Adding base → generally rises
- Adding acid → generally falls
- Determine the shape before equivalence
- Is a weak acid or weak base involved? Consider when its conjugate partner is present in appreciable amounts. A buffer region forms when a weak acid and its conjugate base, or a weak base and its conjugate acid, are present together. The pH then changes more gradually as titrant is added.
- Is a weak acid or weak base involved? Consider when its conjugate partner is present in appreciable amounts. A buffer region forms when a weak acid and its conjugate base, or a weak base and its conjugate acid, are present together. The pH then changes more gradually as titrant is added.
- Determine the equivalence-point pH
- Strong + strong → ~7
- Weak acid + strong base → >7
- Strong acid + weak base → <7
- Weak + weak → depends on relative strengths
- Draw the steep section appropriately
- Most pronounced for strong acid + strong base
- Generally less pronounced when one reactant is weak
- Often no clearly defined steep section for weak acid + weak base
- Draw the excess-titrant region
- Beyond the equivalence point, the excess titrant increasingly determines the pH. The curve generally levels off towards the pH of the excess acid or base.
How to interpret an unfamiliar titration curve
Sometimes an exam hands you a curve with no labels and asks what’s going on. That’s fine because you can work it out backwards. Here’s what each feature tells you.
- Look at the starting pH. A pH below 7 indicates an acidic solution, while a pH above 7 indicates an alkaline solution. A very low or very high starting pH may suggest a strong acid or base, but concentration also affects the starting pH.
- Look at the direction. Rising means a base is being added, falling means an acid is being added.
- Look at the equivalence-point pH. A value above 7 is typical of a weak acid titrated with a strong base, while a value below 7 is typical of a strong acid titrated with a weak base. However, these patterns should be interpreted alongside the other features of the curve.
- Look for a buffer region, where the pH changes gradually as titrant is added. This can occur when a weak acid and its conjugate base, or a weak base and its conjugate acid, are present together. A strong acid–strong base titration does not produce a conventional buffer region.
- Look at the size of the vertical jump. A pronounced pH jump is typical of a strong acid–strong base titration. The jump is generally less pronounced when one reactant is weak, while a weak acid–weak base titration often has no clearly defined steep section. The exact shape also depends on the strengths and concentrations of the reactants.
- If the curve represents a monoprotic weak acid titrated with a strong base, you can estimate its pKa from the half-equivalence point. Find the equivalence volume, halve it, and read the pH at that volume. This pH is approximately equal to the pKa and may help identify the acid if the question provides relevant reference values.
Common mistakes to avoid
These are the slips we see most often. Have a quick scan before your next exam.
- Assuming every equivalence point occurs at pH 7
- Confusing equivalence point with endpoint
- Identifying the equivalence point simply by where the graph crosses pH 7
- Forgetting that weak acids generally have a higher initial pH than strong acids of comparable concentration
- Forgetting that weak bases generally have a lower initial pH than strong bases of comparable concentration
- Drawing all four titration curves with the same steepness
- Failing to show a buffer region where a weak species and its conjugate partner coexist in appreciable amounts, such as before equivalence in a weak acid–strong base titration or after equivalence when a weak base is added to a strong acid.
- Trying to obtain pKa from the equivalence point instead of the half-equivalence point
- Halving the pH instead of halving the volume at equivalence
- Assuming the equivalence point of a weak acid–weak base titration is always at pH 7
- Forgetting to label axes / relevant points on the graph
Revision Blocks
How do you draw a titration curve?
Work through five steps. Identify whether the acid and base are strong or weak, determine the starting pH, decide whether the curve rises or falls, estimate the equivalence point and its pH, then draw the curve towards the pH of the excess titrant.
How do you find the equivalence point on a titration curve?
When the curve has a clear, steep section, the equivalence point can be estimated from the midpoint of that section. It is not necessarily at pH 7: a strong acid–strong base titration typically has an equivalence point around pH 7, while the other combinations may have different equivalence-point pH values.
How do you determine pKa from a titration curve?
Find the equivalence volume and halve it to obtain the half-equivalence volume. Read the pH at that volume. For a monoprotic weak acid titrated with a strong base, this pH is approximately equal to the pKa.
Why is the equivalence point above pH 7 for a weak acid and strong base?
At equivalence, the weak acid has been neutralised, leaving its conjugate base in solution. The conjugate base reacts with water to produce OH⁻ ions, making the solution alkaline. This is why the equivalence-point pH is typically above 7.
Why is the equivalence point below pH 7 for a strong acid and weak base?
At equivalence, the weak base has reacted with the strong acid, leaving its conjugate acid in solution. The conjugate acid reacts with water to produce H₃O⁺ ions, making the solution acidic. This is why the equivalence-point pH is typically below 7.
Does the equivalence point always occur at pH 7?
No. A strong acid-strong base titration typically has an equivalence point around pH 7. For a weak acid-strong base titration, it is typically above 7; for a strong acid-weak base titration, it is typically below 7. For a weak acid-weak base titration, it depends on the relative strengths of the acid and base.
What’s the difference between the equivalence point and the half-equivalence point?
The equivalence point is where the acid and base have reacted in the stoichiometric ratio specified by the balanced equation. The half-equivalence point occurs when half the original weak acid or weak base has been neutralised.
For a monoprotic weak acid titrated with a strong base, pH is approximately equal to pKa at half-equivalence. For a weak base titrated with a strong acid, pOH is approximately equal to pKb at half-equivalence.
Still finding titration curves tricky?
That’s okay. This topic connects acid strength, equilibrium, buffers, and graph skills all at once, after all.
Sometimes, reading more notes isn’t enough. Students may benefit from guided practice and feedback on where their understanding or working goes wrong. At AskMrChan, we help students strengthen their Chemistry understanding and apply it to exam questions.
Enquire today about our Chemistry tuition programmes or to arrange a trial class with us!
